A couple of few years ago I had build a diode-sensor based RF powermeter using a 68HC11 microprocessor. Even before that, I had build an analog RF powermeter with thermal power sensor. And I found datasheets of logarithmic amplifiers very interesting, that promised a measurement bandwidth of up to 2.5GHz. When I had familiarized myself with the Atmel AVR microprocessor family, it was just a logic step to build myself a nice powermeter for all three measurement principles.
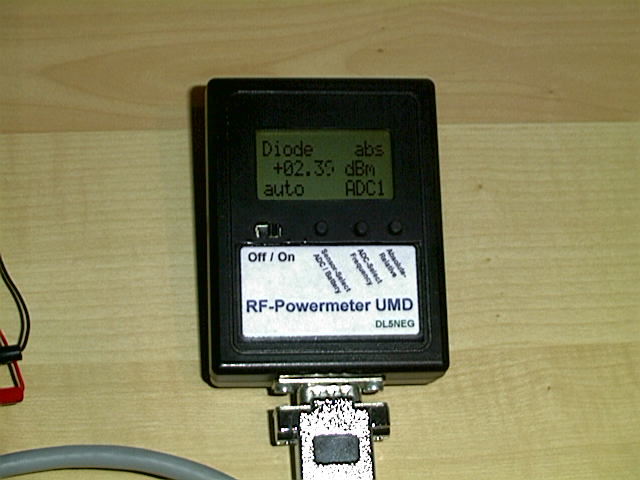
So I did that and build a very small, battery powered powermeter with external power sensors. It is about the size of a cigarette box and I called it UMD, the Universal Measurement Device. It is the nice little device in the picture above. In order to fit everything in, I had to base it completely on tiny surface mount components.
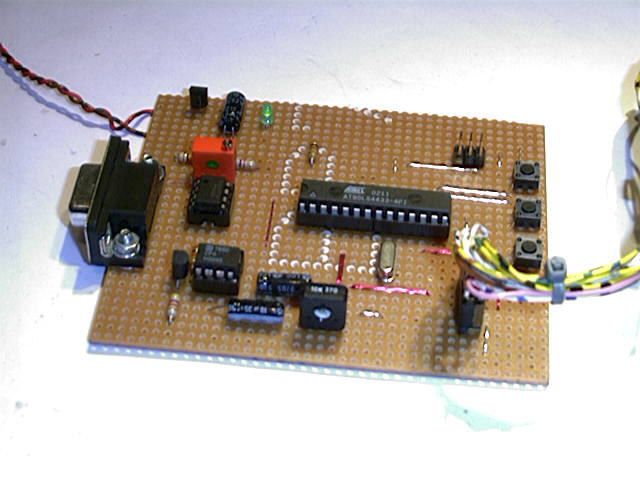
Unfortunately the device contained a few components that were very hard to get (e.g. a special mobile phone LCD display) and it was so tiny, that it was difficult to compare it with my documentation. I had changed the circuit a couple of times during the development, so I could not guarantee that my schematics were correct. When I was asked by some Belgian radio amateurs to write an article for their annual magazine, I decided to rebuild the circuit on a larger board with wired components and a standard 4×16 character LCD display. I call that version article-breadboard version.
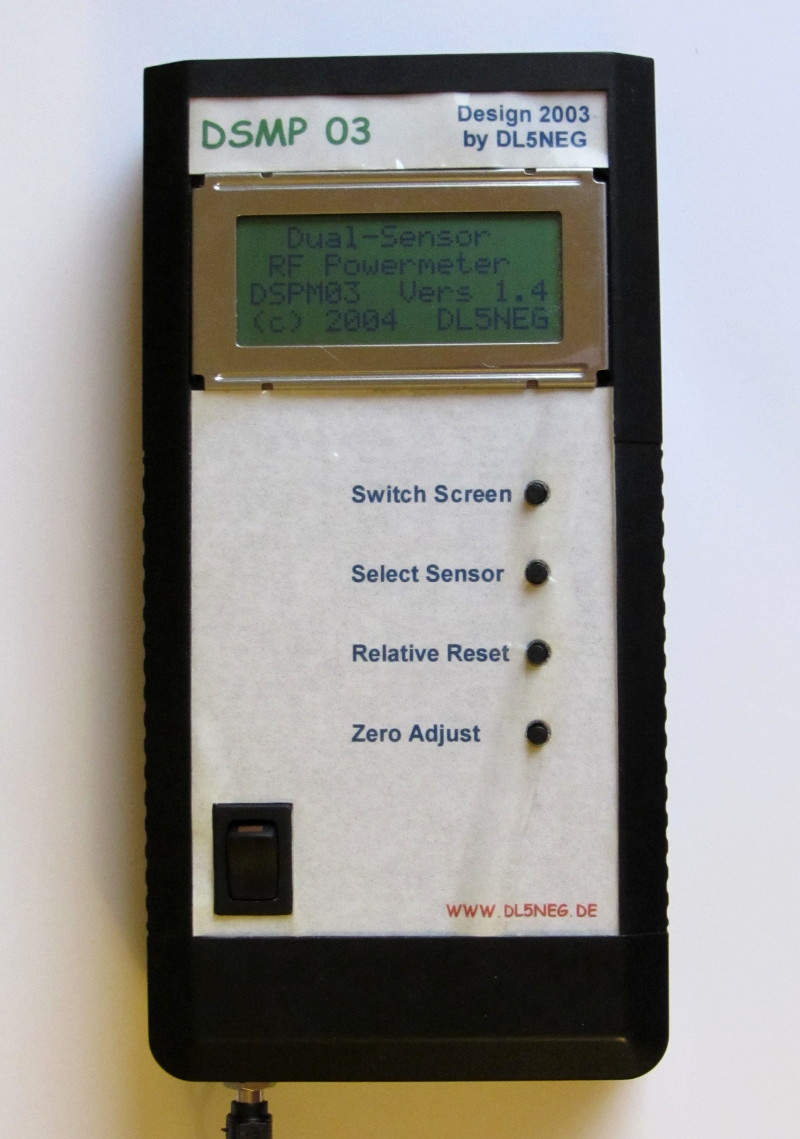
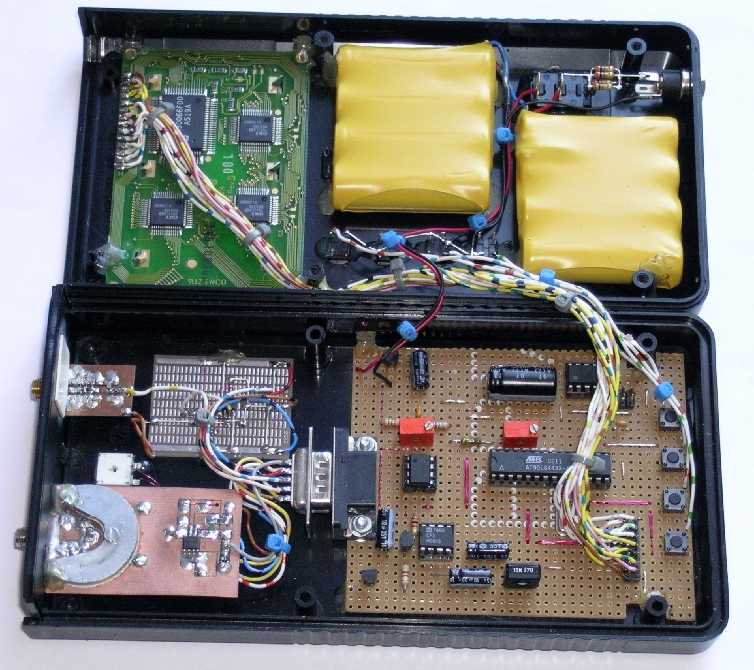
The breadboard was laying around for a few month, until I decided that I should rather use it to build myself another power meter. Since I already had the UMD with the external sensors, I have included the sensors within the meters housing this time. I had almost never used the log-amp sensor on the UMD, so I went for a design with only two sensors: a diode sensor and a thermal power sensor. Since it was kind of a third approach, I have named this version DSPM03, the Dual Sensor Power Meter 03. If you want to copy one of my power meters, I strongly recommend to copy the DSPM03.
1. Electronic hardware
The Powermeter consists of two logic components. One is the digital part, consisting of the processor (including the ADCs), the display and the batteries. The other component is one of different sensors, that transform the RF input power into an analog DC level that can be read by the ADCs in the digital part. The software knows the transfer function from RF power to DC level of the different sensors and is therefore able to calculate the RF input power from the read DC level. The result of the calculation is then written to the LCD. In a special mode the software also displays the “raw ADC value”, i.e. the DC voltage level without transformation to RF power.
Power Sensors
The theory on the sensors, their advantages and disadvantages and which sensor suits which application was worth an separate page, click here to read it.
The sensors that you need for rebuilding the DSPM03 are:
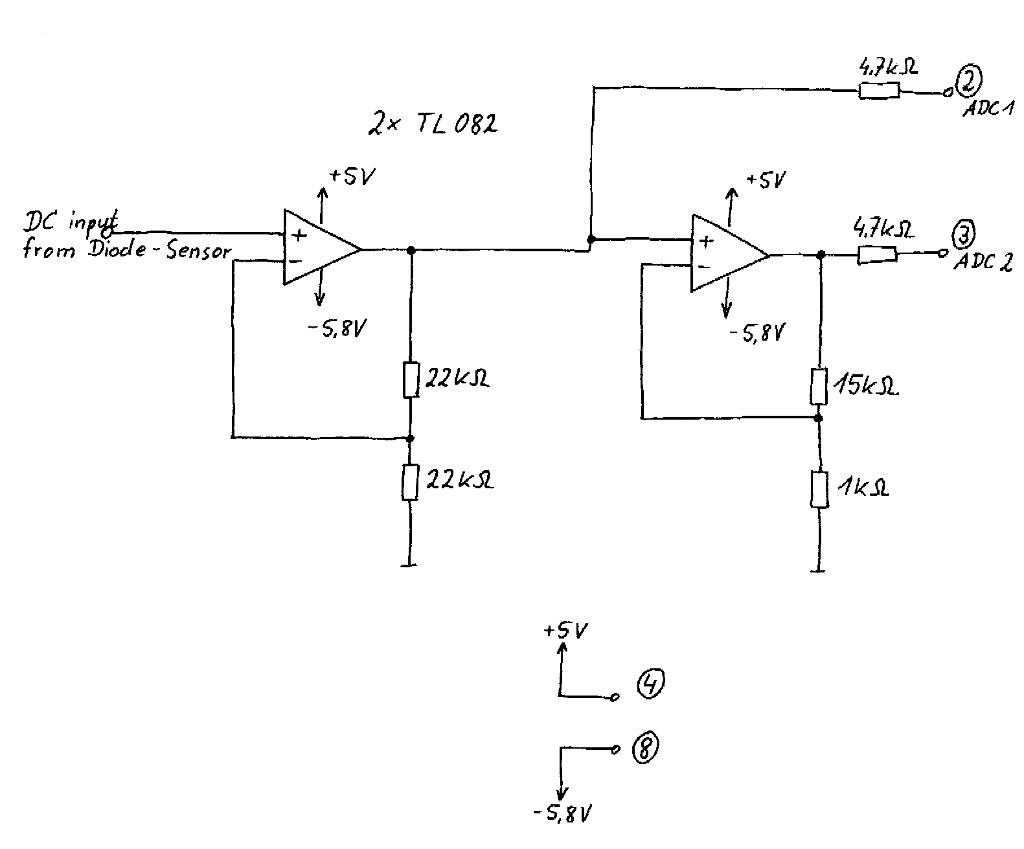
Diode Sensor: How to build a diode sensor that converts an RF signal to a DC voltage is extensively discussed on a separate page, click here to view it. The frequency response (i.e. the unwanted change in behavior over frequency) is really low, it is below 0.5dB up to more than 3.5GHz. So the accuracy of the complete system depends mainly on the quality of the lookup table in the software, which holds one pair of values (DC voltage vs. RF input power) for every dB of input power.
Between the passive diode sensor and the ADC inputs you need a little bit of OpAmp electronics. Here is the schematic of the circuit that you need.
Thermal Power Sensor: Here you find the schematic of the thermal power sensor that I have build for the DSPM03.
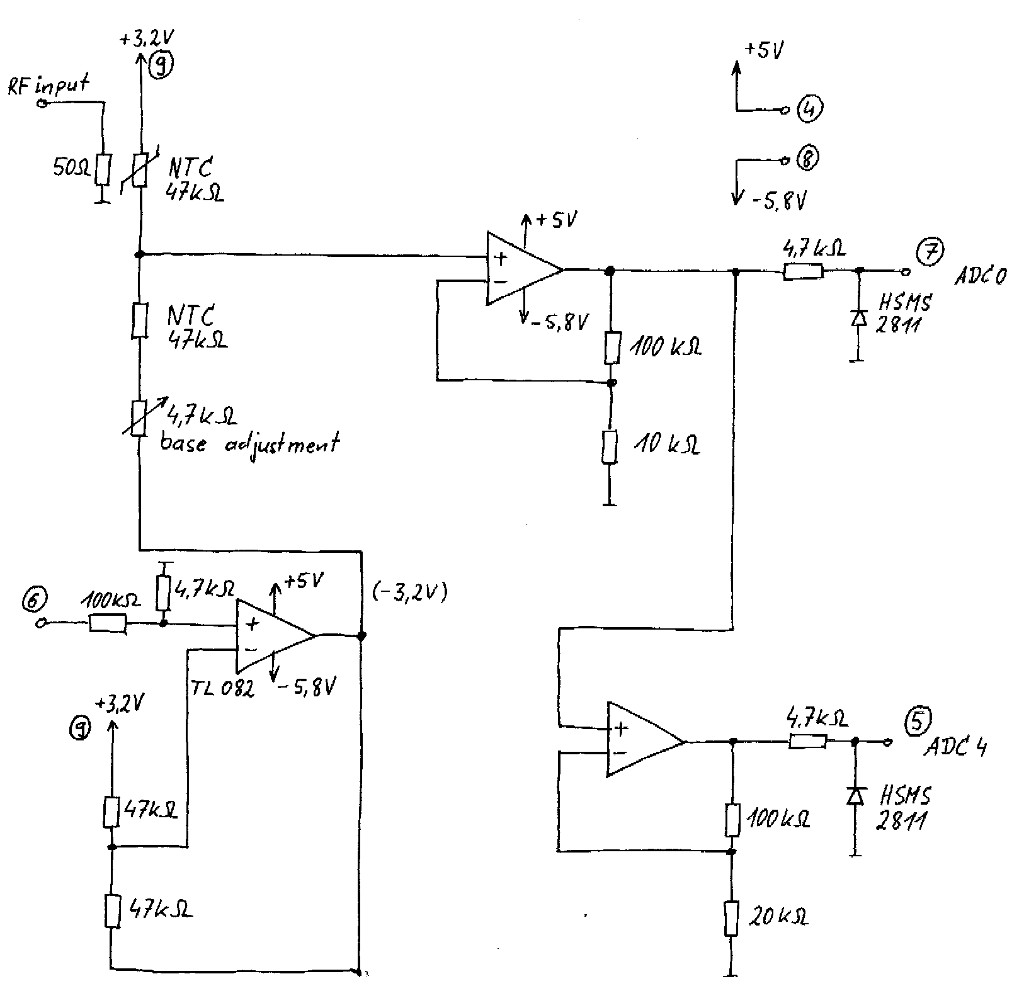
If you have build the sensor, you will notice that the NTCs are never exactly of the same value. In my circuit the lower NTC was of a bit lower resistance. To compensate for that, I have included the 4.7kOhm potentiometer named “base adjustment”. You may have to put a potentiometer in series to the other resistors if that one is lower in your case.
Digital part
There are two schematic diagrams. First there is the DC supply schematic. The main circuitry runs on +5Volts. However, some of the sensor run on 3.2 Volts and also the reference voltage for the ADCs is 3.2 Volts. Therefore we need an +5V regulator and one for 3.2 Volts. Since 3.2 Volt regulators are a bit tricky to get, I have decided to build it myself with an opamp and a NPN transistor. If you have a 3.2 Volt regulator available, please feel free to use it. A +6V regulator is used to generate the input for a voltage inverter (see main schematic).
As power source I have used 8 NiCd cells, but any voltage from 8 to 14 Volts is ok. So if you want to use a DC power supply feel free to do so (after all, its you circuit!). There is a voltage divider from VBat to the input of ADC No. 3. It divides by four, so the maximum supply voltage that can be measured with a 3.2V referenced ADC is 12.8 Volts. Due to the high series resistor, the ADC will not be damaged if you use up to 14 Volts, just the displayed battery voltage will not go beyond 12.8 Volts.
The main schematic diagram consists of the microprocessor, the connection to the LCD, the internal connector to the power sensors and the negative voltage circuit that sets the LCD contrast. A 4×16 standard LCD needs a typical contrast voltage of -0.35 Volts for best readability. If you skip that and tie Vcontrast to ground, the LCD will still work well, just the contrast is a bit week. Since the amplifiers for the sensor signals require a negative voltage, we have to produce the -5Volts anyhow, so why not use it for a good LCD contrast as well.
The microprocessor in the schematic is a AT90S4433 which is discontinued. I have switched to the drop-in compatible ATmega8 microprocessor. The schematic is absolutely unchanged, but the software is not fully compatible. Use software version 2.0 or higher with the ATmega8.
2. Software
The firmware is written in C, compiled with the free WinAVR GNU C compiler, downloaded from the AVR-freaks homepage. If you want to edit the code and recompile it, you can download the compiler together with the simulator (AVR-Studio) at www.avrfreaks.net. There you will also find links to numerous free and low-cost programmers to load the firmware from your PC to the microprocessor.
The latest version for the AT90S4433 is 1.4, it additionally supports to set a fixed pre-attenuation, that is added to all measured results. This is very helpful if you have an attenuator or an directional coupler at the input of your meter to measure higher input powers. Also to compensate for the loss of your cable between signal source and sensor this is helpful. And since even negative pre-attenuation values are possible, you can also compensate for amplifiers that you use to measure very tiny signals below the sensitivity of the meter.
Also the new version 2.0 for the ATmega8 microprocessor is available in source and hex format now. The feature set is identical to version 1.4, which is not compatible with the ATmega8.
Version 1.4 for AT90S4433
Version 2.0 for ATmega8
- Download the C source code here: dspm03 (Version2.0).c
- Download the firmware as binary here: dspm03 (Version2.0).hex
Getting-Started Manual
After power-on you will see a greeting message for three seconds. After that, there are five different screens, which can be switched through by pressing button No. 1.
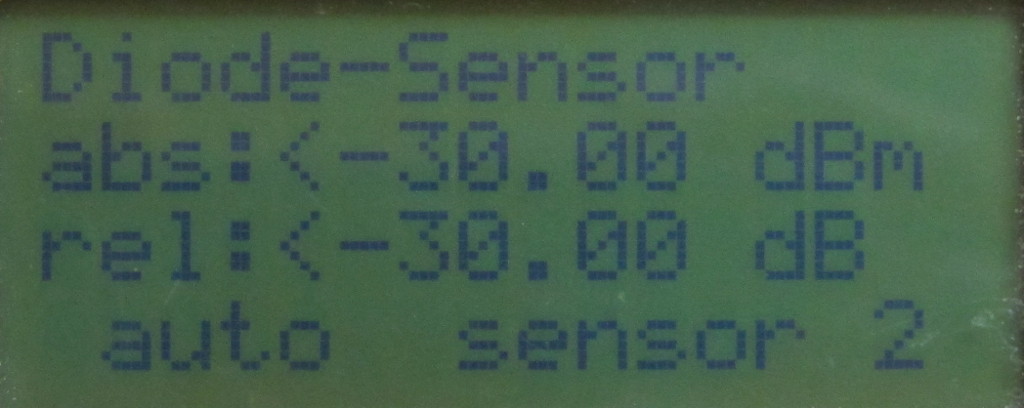
The diode-sensor screen interprets the ADC readings as output of the diode sensor and displays the calculated RF input power in dBm. Line two shows the absolute power in dBm, line 3 shows the power in dB relative to the power when you pressed the “relative reset” button.
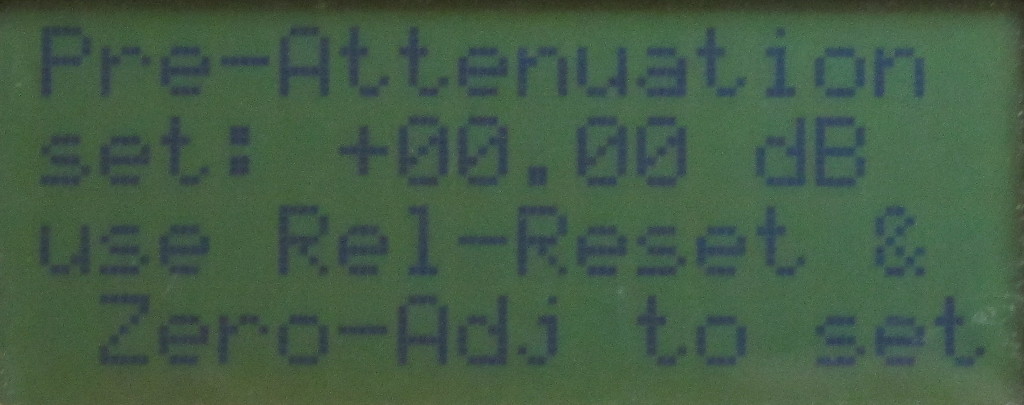
The pre-attenuation screen lets you select a fixed attenuation value that is added to every displayed result. Positive values mean attenuation (like resistive attenuators, directional couplers, etc.), negative values are used if you have an amplifier of a certain gain before your sensor. Use buttons 3 and 4 to increase and decrease the shown value. A fuzzy logic will support you in faster reaching the desired attenuation value. Whenever a pre-attenuation other than 0dB is selected, this is indicated by an ‘A’ in the upper right corner of the result screens.
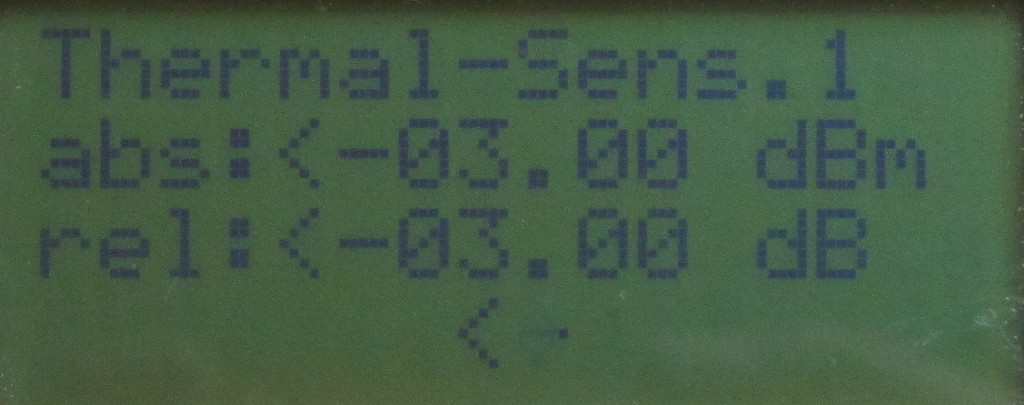
The thermal-sensor screen interprets the ADC readings as output of the thermal sensor and displays the calculated RF input power in dBm. Line two shows the absolute power in dBm, line 3 shows the power in dB relative to the power when you pressed “relative reset”. Line 4 shows the zero-indicator. A <> in the middle of the LCD indicates perfect zeroing. A drift of the zero-point is shown by longer and longer arrows to one side.
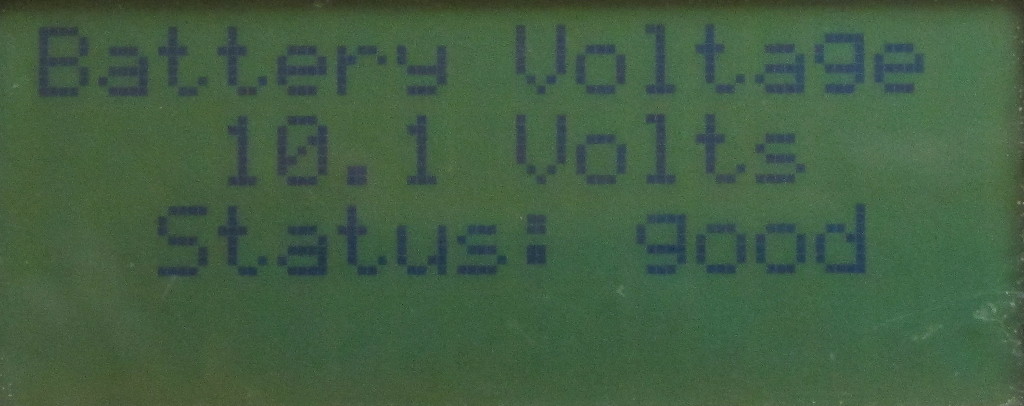
The battery voltage screen shows the battery voltage in Volts and shows “Status good” at voltages above 8 Volts, “Status poor” at voltages below 8 Volts. At status poor, the sensor results are not reliable.
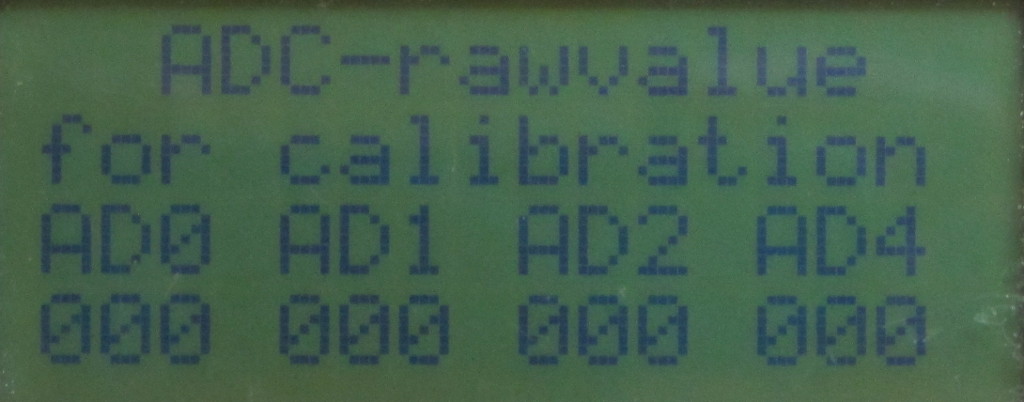
The raw-ADC value Screen shows the readings from the four used ADCs as raw hex-value.
Button No. 2 lets you choose the power range (or switch to auto range when you use the diode sensor, which is default ).
With button No. 3 you can reset the relative power reading. The input power at that moment is used for later relative readings. Very useful if you want to know how changes in your setup affect the output power. E.g. longer or different cable, changed biasing values etc.
Button No. 4 is triggering the automatic zero adjust for the thermal sensor. It is only functional when thermal sensor data are shown. A “Z” in the upper right corner of the LCD shows that automatic zeroing is currently active. Be patient, the process can take up to 20 seconds. Automatic zeroing will automatically switch itself off, as soon as the zero point is reached. Please note that the internal zero point for thermal sensors 1 and 2 is different, i.e. if you switch from on sensor to the other, you have to trigger the zeroing again.